Cross-condition Patches - Mascharak#
In this tutorial we aim to show how Patches can be applied to new datasets using the data originating from v3 sequencing runs contained in the Mascharak (2022) dataset.
The data is a combination of PBS & Verteporfin treated cells collected at time points POD7, POD14 and POD30 .
Please refer to the interpretable tutorial for assessment of biological implications.
# Minimal imports
from ladder.data import get_data # Needed to grab data
from ladder.scripts import CrossConditionWorkflow # Our workflow object to run the cross-conditional model
import umap, torch, pyro # To set seeds + umaps
import torch.optim as opt # For defining out optimizer


# For plotting
import numpy as np
import pandas as pd
import seaborn as sns
import matplotlib.pyplot as plt
import matplotlib.gridspec as gridspec
from umap import UMAP

# For data loading
import anndata as ad
import scanpy as sc

# Set up plots
import os
os.makedirs('plots', exist_ok=True)


klee_palette = [
    "#8B1E3F",  # Deep Burgundy
    "#3B5998",  # Rich Blue
    "#F4A261",  # Warm Orange
    "#264653",  # Deep Teal
    "#E9C46A",  # Soft Yellow
    "#2A9D8F",  # Muted Green
    "#E76F51",  # Burnt Sienna
    "#D3D9E3",  # Soft Pastel Blue
    "#A8DADC",  # Pale Turquoise
    "#BC4749",  # Warm Cranberry Red
]

klee_palette_masch = [
    "#3B5998",  # Rich Blue
    "#6A994E",  # Fresh Olive Green
    "#F4A261",  # Warm Orange
    "#E9C46A",  # Soft Yellow
    "#2A9D8F",  # Muted Green
    "#E76F51",  # Burnt Sienna
    "#FFC8A2",  # Soft Peach
    "#A8DADC",  # Pale Turquoise
    "#BC4749",  # Warm Cranberry Red
]
# Helpers for plotting

# Courtesy of: https://stackoverflow.com/questions/7965743/how-can-i-set-the-aspect-ratio
def force_aspect(ax,aspect=1):
    im = ax.get_images()
    extent =  im[0].get_extent()
    ax.set_aspect(abs((extent[1]-extent[0])/(extent[3]-extent[2]))/aspect)


def grab_params(workflow, model, data="Vu"):
    ## Parameters for UMAP
    reducer_base = umap.UMAP(n_neighbors=50, min_dist=0.1, metric="correlation", verbose=False, random_state=42)
    reducer = umap.UMAP(n_neighbors=50, min_dist=0.1, metric="correlation", verbose=False, random_state=42)

    ## All data reductions we need for the plots

    match model:
        case "Patches":
            base_umap = reducer_base.fit_transform(np.array(workflow.anndata.X.todense()))
            z_umap = reducer.fit_transform(workflow.anndata.obsm['patches_z_latent']) ## Z
            w_umap = reducer.fit_transform(workflow.anndata.obsm['patches_w_latent']) ## W
            rho_umap = reducer.fit_transform(workflow.anndata.obsm['patches_rho_latent']) ## rho

            w_pca = sc.pp.pca(workflow.anndata.obsm['patches_w_latent'], random_state=42)[:,:2] ## W PCA, grab first 2 PCs
            z_pca = sc.pp.pca(workflow.anndata.obsm['patches_z_latent'], random_state=42)[:,:2] ## Z PCA, grab first 2 PCs


            df = pd.DataFrame(base_umap)
            df.index = workflow.anndata.obs.index

            df.columns = ["base_1", "base_2"]
            df["z_umap_1"], df["z_umap_2"] = z_umap[:,0], z_umap[:,1]
            df["w_umap_1"], df["w_umap_2"] = w_umap[:,0], w_umap[:,1]
            df["rho_umap_1"], df["rho_umap_2"] = rho_umap[:,0], rho_umap[:,1]
            df["z_pc_1"], df["z_pc_2"] = z_pca[:,0], z_pca[:,1]
            df["w_pc_1"], df["w_pc_2"] = w_pca[:,0], w_pca[:,1]

        case "SCANVI":
            base_umap = reducer_base.fit_transform(np.array(workflow.anndata.X.todense()))
            u_umap = reducer.fit_transform(workflow.anndata.obsm['scanvi_u_latent']) ## W
            u_pca = sc.pp.pca(workflow.anndata.obsm['scanvi_u_latent'], random_state=42)[:,:2]
            z_umap = reducer.fit_transform(workflow.anndata.obsm['scanvi_z_latent']) ## W
            z_pca = sc.pp.pca(workflow.anndata.obsm['scanvi_z_latent'], random_state=42)[:,:2]

            df = pd.DataFrame(base_umap)
            df.index = workflow.anndata.obs.index

            df.columns = ["base_1", "base_2"]

            df["u_umap_1"], df["u_umap_2"] = u_umap[:,0], u_umap[:,1]
            df["u_pc_1"], df["u_pc_2"] = u_pca[:,0], u_pca[:,1]
            df["z_umap_1"], df["z_umap_2"] = z_umap[:,0], z_umap[:,1]
            df["z_pc_1"], df["z_pc_2"] = z_pca[:,0], z_pca[:,1]


        case "SCVI":
            base_umap = reducer_base.fit_transform(np.array(workflow.anndata.X.todense()))
            z_umap = reducer.fit_transform(workflow.anndata.obsm['scvi_latent'])
            z_pca = sc.pp.pca(workflow.anndata.obsm['scvi_latent'], random_state=42)[:,:2]

            df = pd.DataFrame(base_umap)
            df.index = workflow.anndata.obs.index

            df.columns = ["base_1", "base_2"]
            df["z_umap_1"], df["z_umap_2"] = z_umap[:,0], z_umap[:,1]
            df["z_pc_1"], df["z_pc_2"] = z_pca[:,0], z_pca[:,1]

        case "Base":
            anndata = workflow.anndata.copy()
            anndata.X = anndata.layers["normalized"]

            sc.pp.normalize_total(anndata, target_sum=1e4)
            sc.pp.log1p(anndata)
            sc.tl.pca(anndata, svd_solver="arpack")

            base_umap = reducer_base.fit_transform(np.array(anndata.X.todense()))
            base_pca = anndata.obsm['X_pca'][:,:2]

            df = pd.DataFrame(base_umap)
            df.index = anndata.obs.index

            df.columns = ["base_umap_1", "base_umap_2"]
            df["base_pc_1"], df["base_pc_2"] = base_pca[:,0], base_pca[:,1]


    match data:
        case "Vu":
            df["broad_type"], df["age"], df["time"], df["factorized"] = workflow.anndata.obs["broad_type"], workflow.anndata.obs["age"], workflow.anndata.obs["time"], workflow.anndata.obs["factorized"]
        case "Mascharak":
            df["broad_type"], df["treatment"], df["time"], df["factorized"] = workflow.anndata.obs["broad_type"], workflow.anndata.obs["treatment"], workflow.anndata.obs["time"], workflow.anndata.obs["factorized"]


    return df
Setting up the data#
get_data("Mascharak")
# Load the anndata object
anndata_mascharak = ad.read_h5ad("data/mascharak_2022_tn_wh.h5ad")
anndata_mascharak.layers["normalized"] = anndata_mascharak.X
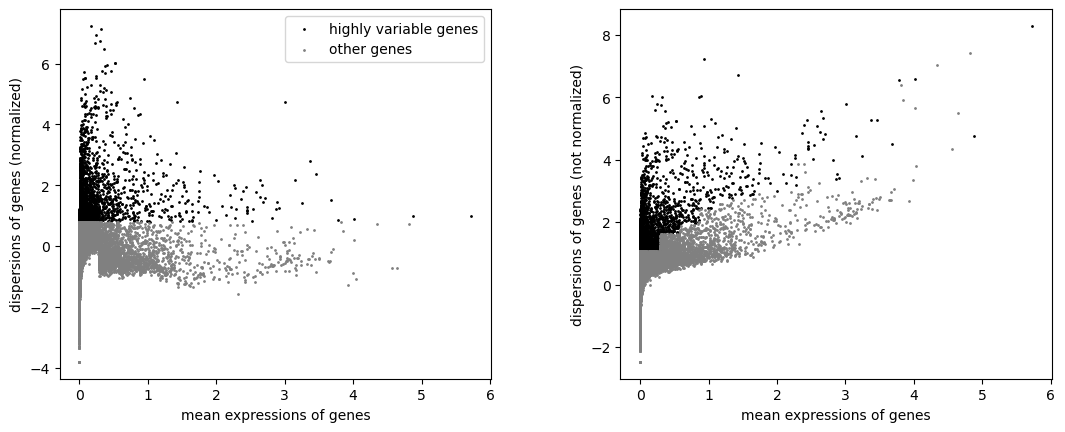
# Find/subset HVGs & swap to raw counts
sc.pp.highly_variable_genes(anndata_mascharak, n_top_genes=3000)
sc.pl.highly_variable_genes(anndata_mascharak)
anndata_mascharak = anndata_mascharak[:, anndata_mascharak.var["highly_variable"]]
anndata_mascharak.X = anndata_mascharak.layers["counts"]
anndata_mascharak
View of AnnData object with n_obs × n_vars = 2284 × 3000
    obs: 'time', 'treatment', 'sample', 'n_genes_by_counts', 'log1p_n_genes_by_counts', 'total_counts', 'log1p_total_counts', 'pct_counts_in_top_50_genes', 'pct_counts_in_top_100_genes', 'pct_counts_in_top_200_genes', 'pct_counts_in_top_500_genes', 'total_counts_mt', 'log1p_total_counts_mt', 'pct_counts_mt', 'total_counts_ribo', 'log1p_total_counts_ribo', 'pct_counts_ribo', 'total_counts_hb', 'log1p_total_counts_hb', 'pct_counts_hb', 'n_counts', 'leiden', 'broad_type'
    var: 'mt', 'ribo', 'hb', 'n_cells_by_counts', 'mean_counts', 'log1p_mean_counts', 'pct_dropout_by_counts', 'total_counts', 'log1p_total_counts', 'highly_variable', 'means', 'dispersions', 'dispersions_norm'
    uns: 'broad_type_colors', 'dendrogram_broad_type', 'dendrogram_leiden', 'hvg', 'leiden', 'leiden_colors', 'log1p', 'neighbors', 'pca', 'rank_genes_groups', 'sample_colors', 'time_colors', 'treatment_colors', 'umap'
    obsm: 'X_pca', 'X_umap'
    varm: 'PCs'
    layers: 'counts', 'normalized'
    obsp: 'connectivities', 'distances'
Initializing and running the workflow#
workflow = CrossConditionWorkflow(anndata_mascharak, verbose=True, random_seed=42)

factors = ["time", "treatment", "broad_type"]
workflow.prep_model(factors, cell_type_label_key="broad_type", model_type='Patches')

# Train the model
if not os.path.exists('params/patches_mascharak_pyro.pth'):
    workflow.run_model(max_epochs=20000, convergence_threshold=1e-5, convergence_window=1000)
    workflow.save_model("params/patches_mascharak")

else:
    workflow.load_model('params/patches_mascharak')
workflow.evaluate_reconstruction()
Calculating RMSE ...
Calculating Profile Correlation ...
Calculating 2-Sliced Wasserstein ...
Calculating Chamfer Discrepancy ...
Results
===================
RMSE : 3.876 +- 0.164
Profile Correlation : 0.989 +- 0.002
2-Sliced Wasserstein : 12.679 +- 1.819
Chamfer Discrepancy : 140.474 +- 64.244
{'RMSE': [3.876, 0.164],
 'Profile Correlation': [0.989, 0.002],
 '2-Sliced Wasserstein': [12.679, 1.819],
 'Chamfer Discrepancy': [140.474, 64.244]}
workflow.write_embeddings()
df_patches = grab_params(workflow, "Patches", "Mascharak")
df_base = grab_params(workflow, "Base", "Mascharak")
Written embeddings to object 'anndata.obsm' under workflow.
WARNING: adata.X seems to be already log-transformed.
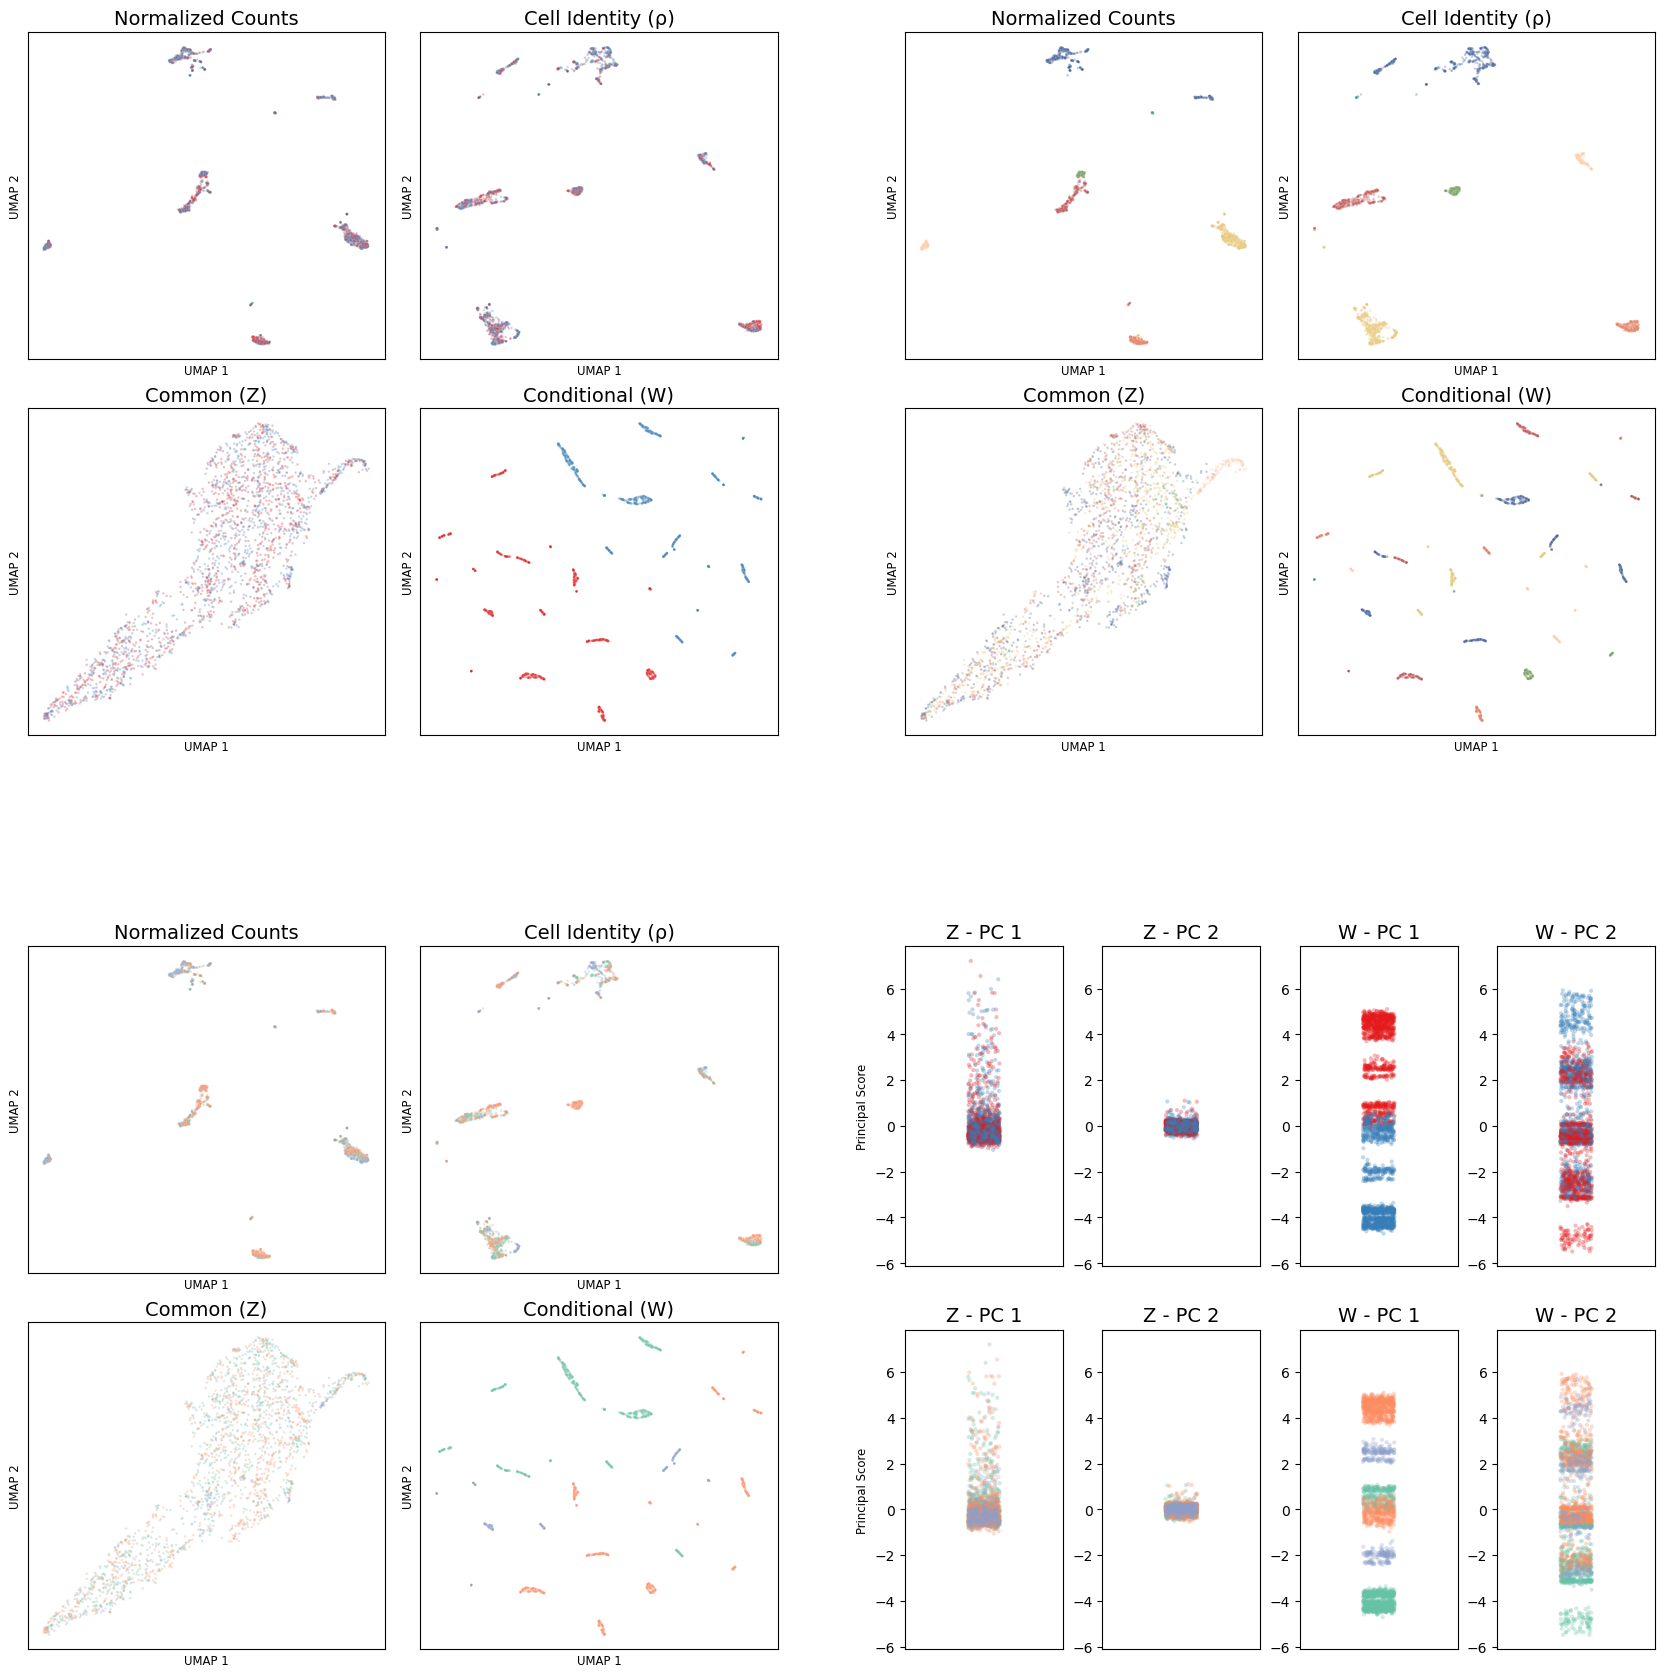
Inspecting representations#
# Figure skeleton

fontsize=14
alpha=0.3
s=3

## Create a figure with a 2x2 grid of subplots
fig = plt.figure(figsize=(21, 21))

## Define a GridSpec with a 2x2 layout
gs = gridspec.GridSpec(2, 2, wspace=0.17, hspace = 0.3, figure=fig)

## Create subplots for the 2x2 grid
ax = [fig.add_subplot(gs[i//2, i%2]) for i in range(4)]

for subax in ax:
    subax.axis('off')

## Define a new GridSpec for axis to split vertically
gs_inner_topleft = gridspec.GridSpecFromSubplotSpec(2, 2, subplot_spec=gs[0, 0], wspace=0.1, hspace=0.15)
gs_inner_topright = gridspec.GridSpecFromSubplotSpec(2, 2, subplot_spec=gs[0, 1], wspace=0.1, hspace=0.15)
gs_inner_botleft = gridspec.GridSpecFromSubplotSpec(2, 2, subplot_spec=gs[1, 0], wspace=0.1, hspace=0.15)
gs_inner_botright = gridspec.GridSpecFromSubplotSpec(2, 4, subplot_spec=gs[1, 1], wspace=0.25)


## Create subplots for the inner grid
ax_inner_topleft = [fig.add_subplot(gs_inner_topleft[i//2, i%2]) for i in range(4)]
ax_inner_topright = [fig.add_subplot(gs_inner_topright[i//2, i%2]) for i in range(4)]
ax_inner_botleft = [fig.add_subplot(gs_inner_botleft[i//2, i%2]) for i in range(4)]

## Specific for botright
ax_inner_botright = [fig.add_subplot(gs_inner_botright[0,0])]
ax_inner_botright = ax_inner_botright \
+ [
    fig.add_subplot(gs_inner_botright[0,1],sharey=ax_inner_botright[0]),
    fig.add_subplot(gs_inner_botright[0,2],sharey=ax_inner_botright[0]),
    fig.add_subplot(gs_inner_botright[0,3],sharey=ax_inner_botright[0]),
    fig.add_subplot(gs_inner_botright[1,0],sharey=ax_inner_botright[0]),
    fig.add_subplot(gs_inner_botright[1,1],sharey=ax_inner_botright[0]),
    fig.add_subplot(gs_inner_botright[1,2],sharey=ax_inner_botright[0]),
    fig.add_subplot(gs_inner_botright[1,3],sharey=ax_inner_botright[0]),
]

#Counts
ct = sns.scatterplot(df_base, x='base_umap_1', y='base_umap_2', ax=ax_inner_topright[0], hue = 'broad_type', palette=sns.color_palette(klee_palette_masch), s=s, alpha=alpha)
trt = sns.scatterplot(df_base, x='base_umap_1', y='base_umap_2', ax=ax_inner_topleft[0], hue = 'treatment', palette='Set1', s=s, alpha=alpha)
time = sns.scatterplot(df_base, x='base_umap_1', y='base_umap_2', ax=ax_inner_botleft[0], hue = 'time', palette='Set2', s=s, alpha=alpha)


#Identities
sns.scatterplot(df_patches, x='rho_umap_1', y='rho_umap_2', ax=ax_inner_topright[1], hue = 'broad_type', palette=sns.color_palette(klee_palette_masch), s=s, alpha=alpha, legend=False)
sns.scatterplot(df_patches, x='rho_umap_1', y='rho_umap_2', ax=ax_inner_topleft[1], hue = 'treatment', palette='Set1', s=s, alpha=alpha, legend=False)
sns.scatterplot(df_patches, x='rho_umap_1', y='rho_umap_2', ax=ax_inner_botleft[1], hue = 'time', palette='Set2', s=s, alpha=alpha, legend=False)

#Zs
sns.scatterplot(df_patches, x='z_umap_1', y='z_umap_2', ax=ax_inner_topright[2], hue = 'broad_type', palette=sns.color_palette(klee_palette_masch), s=s, alpha=alpha, legend=False)
sns.scatterplot(df_patches, x='z_umap_1', y='z_umap_2', ax=ax_inner_topleft[2], hue = 'treatment', palette='Set1', s=s, alpha=alpha, legend=False)
sns.scatterplot(df_patches, x='z_umap_1', y='z_umap_2', ax=ax_inner_botleft[2], hue = 'time', palette='Set2', s=s, alpha=alpha, legend=False)

#Ws
sns.scatterplot(df_patches, x='w_umap_1', y='w_umap_2', ax=ax_inner_topright[3], hue = 'broad_type', palette=sns.color_palette(klee_palette_masch), s=s, alpha=alpha, legend=False)
sns.scatterplot(df_patches, x='w_umap_1', y='w_umap_2', ax=ax_inner_topleft[3], hue = 'treatment', palette='Set1', s=s, alpha=alpha, legend=False)
sns.scatterplot(df_patches, x='w_umap_1', y='w_umap_2', ax=ax_inner_botleft[3], hue = 'time', palette='Set2', s=s, alpha=alpha, legend=False)


sns.stripplot(df_patches, y = "z_pc_1", hue='treatment', zorder=1, alpha=alpha, s=s, ax=ax_inner_botright[0], legend=False, palette='Set1')
#ax_inner_botright[0].axvline(zorder=2, color='black', linestyle = 'dashed')

sns.stripplot(df_patches, y = "z_pc_2", hue='treatment', zorder=1, alpha=alpha, s=s, ax=ax_inner_botright[1], legend=False, palette='Set1')
#ax_inner_botright[1].axvline(zorder=2, color='black', linestyle = 'dashed')

sns.stripplot(df_patches, y = "w_pc_1", hue='treatment', zorder=1, alpha=alpha, s=s, ax=ax_inner_botright[2], legend=False, palette='Set1')
#ax_inner_botright[2].axvline(zorder=2, color='black', linestyle = 'dashed')

sns.stripplot(df_patches, y = "w_pc_2", hue='treatment', zorder=1, alpha=alpha, s=s, ax=ax_inner_botright[3], legend=False, palette='Set1')
#ax_inner_botright[3].axvline(zorder=2, color='black', linestyle = 'dashed')


sns.stripplot(df_patches, y = "z_pc_1", hue='time', zorder=1, alpha=alpha, s=s, ax=ax_inner_botright[4], legend=False, palette='Set2')
#ax_inner_botright[4].axvline(zorder=2, color='black', linestyle = 'dashed')

sns.stripplot(df_patches, y = "z_pc_2", hue='time', zorder=1, alpha=alpha, s=s, ax=ax_inner_botright[5], legend=False, palette='Set2')
#ax_inner_botright[5].axvline(zorder=2, color='black', linestyle = 'dashed')

sns.stripplot(df_patches, y = "w_pc_1", hue='time', zorder=1, alpha=alpha, s=s, ax=ax_inner_botright[6], legend=False, palette='Set2')
#ax_inner_botright[6].axvline(zorder=2, color='black', linestyle = 'dashed')

sns.stripplot(df_patches, y = "w_pc_2", hue='time', zorder=1, alpha=alpha, s=s, ax=ax_inner_botright[7], legend=False, palette='Set2')
#ax_inner_botright[7].axvline(zorder=2, color='black', linestyle = 'dashed')


for subax in ax_inner_topright:
    subax.set_xticklabels([])
    subax.set_xticks([])
    subax.set_yticklabels([])
    subax.set_yticks([])
    subax.set_xlabel('UMAP 1', fontsize=fontsize*0.6)
    subax.set_ylabel('UMAP 2', fontsize=fontsize*0.6)

    try:
        force_aspect(subax)
    except:
        pass

for subax in ax_inner_topleft:
    subax.set_xticklabels([])
    subax.set_xticks([])
    subax.set_yticklabels([])
    subax.set_yticks([])
    subax.set_xlabel('UMAP 1', fontsize=fontsize*0.6)
    subax.set_ylabel('UMAP 2', fontsize=fontsize*0.6)

    try:
        force_aspect(subax)
    except:
        pass


for subax in ax_inner_botleft:
    subax.set_xticklabels([])
    subax.set_xticks([])
    subax.set_yticklabels([])
    subax.set_yticks([])
    subax.set_xlabel('UMAP 1', fontsize=fontsize*0.6)
    subax.set_ylabel('UMAP 2', fontsize=fontsize*0.6)

    try:
        force_aspect(subax)
    except:
        pass

for i in range(len(ax_inner_botright)):
    subax = ax_inner_botright[i]
    subax.set_xticklabels([])
    subax.set_xticks([])
    subax.set_xlabel('')
    subax.set_ylabel('')


ax_inner_botright[0].set_ylabel('Principal Score', fontsize=fontsize*0.6)
ax_inner_botright[4].set_ylabel('Principal Score', fontsize=fontsize*0.6)


ct_h, ct_l = ct.get_legend_handles_labels()
trt_h, trt_l = trt.get_legend_handles_labels()
time_h, time_l = time.get_legend_handles_labels()
time_l = ['2DPW', '7DPW', '14DPW', '30DPW']

ct.legend([], frameon=False); trt.legend([], frameon=False); time.legend([], frameon=False)

'''
ct_leg = fig.legend(ct_h, ct_l, title='Cell Types\n', loc="center left", bbox_to_anchor=(0.45,0.7), fontsize='x-large', title_fontproperties={'weight' : 'bold', 'size' : 'xx-large'}, markerscale=10, frameon=False)
trt_leg = fig.legend(trt_h, trt_l, title='Treatment\n', loc="center", bbox_to_anchor=(0.505,0.5), fontsize='x-large', title_fontproperties={'weight' : 'bold', 'size' : 'xx-large'}, markerscale=10, frameon=False)
time_leg = fig.legend(time_h, time_l, title='Time Point\n', loc="center", bbox_to_anchor=(0.505,0.3), fontsize='x-large', title_fontproperties={'weight' : 'bold', 'size' : 'xx-large'}, markerscale=10, frameon=False)


for lh in ct_leg.legend_handles:
    lh.set_alpha(1)

for lh in trt_leg.legend_handles:
    lh.set_alpha(1)

for lh in time_leg.legend_handles:
    lh.set_alpha(1)

'''


ax_inner_topleft[0].set_title('Normalized Counts', fontsize=fontsize)
ax_inner_topleft[1].set_title('Cell Identity (ρ)', fontsize=fontsize)
ax_inner_topleft[2].set_title('Common (Z)', fontsize=fontsize)
ax_inner_topleft[3].set_title('Conditional (W)', fontsize=fontsize)

ax_inner_topright[0].set_title('Normalized Counts', fontsize=fontsize)
ax_inner_topright[1].set_title('Cell Identity (ρ)', fontsize=fontsize)
ax_inner_topright[2].set_title('Common (Z)', fontsize=fontsize)
ax_inner_topright[3].set_title('Conditional (W)', fontsize=fontsize)

ax_inner_botleft[0].set_title('Normalized Counts', fontsize=fontsize)
ax_inner_botleft[1].set_title('Cell Identity (ρ)', fontsize=fontsize)
ax_inner_botleft[2].set_title('Common (Z)', fontsize=fontsize)
ax_inner_botleft[3].set_title('Conditional (W)', fontsize=fontsize)


ax_inner_botright[0].set_title('Z - PC 1', fontsize=fontsize)
ax_inner_botright[1].set_title('Z - PC 2', fontsize=fontsize)
ax_inner_botright[2].set_title('W - PC 1', fontsize=fontsize)
ax_inner_botright[3].set_title('W - PC 2', fontsize=fontsize)
ax_inner_botright[4].set_title('Z - PC 1', fontsize=fontsize)
ax_inner_botright[5].set_title('Z - PC 2', fontsize=fontsize)
ax_inner_botright[6].set_title('W - PC 1', fontsize=fontsize)
ax_inner_botright[7].set_title('W - PC 2', fontsize=fontsize)


"""
ax_topleft = fig.add_subplot(gs_inner_topleft[:])
ax_topleft.axis('off')
ax_topleft.set_title('Cell Types', fontsize=fontsize*1.2, pad=50, weight='bold')

ax_topright = fig.add_subplot(gs_inner_topright[:])
ax_topright.axis('off')
ax_topright.set_title('Treatment', fontsize=fontsize*1.2, pad=50, weight='bold')

ax_botleft = fig.add_subplot(gs_inner_botleft[:])
ax_botleft.axis('off')
ax_botleft.set_title('Time Points', fontsize=fontsize*1.2, pad=50, weight='bold')


ax_botright = fig.add_subplot(gs_inner_botright[:])
ax_botright.axis('off')
ax_botright.set_title('Latent PCs', fontsize=fontsize*1.2, pad=50, weight='bold')
"""


plt.savefig('plots/mascharak_patches_squared.png', dpi=300, bbox_inches='tight')
plt.show()